Summer internship at Vespa
Photo by Arnold Francisca on Unsplash
Through the summer as an intern at Vespa I got the opportunity to learn new technologies and experience how it is to work for a software company. At the start of my internship I got an introduction to the company and was told about the projects I was going to work on during the internship.
During the internship I worked on two projects. The first one was to recreate the Vespa Query Builder using React, and the second one was to create a solution for visualizing the traces made by the Vespa engine. Both of these projects have been implemented into a client.
Query Builder
The Query Builder is a tool for creating Vespa queries. The tool is a website that helps with creating the queries by allowing the user to select query-options from drop-down menus. The old website consisted of a HTML website with some old, hard to read, JavaScript code, and a backend handler written in Java. This made the website separate and hard to integrate with other tools.
My assignment was to recreate the Query Builder using React making it a complete JavaScript application. Before I started on the assignment I spent a day learning about React, and then I dove into the deep end and started on creating the application, learning more as I went. The old JavaScript code was difficult to read and did not merge well with React so many functionalities had to be recreated from scratch.
The finished application looks very much like the old one, but since it is created in React it is much simpler to implement it in other React applications. I did update the UI some by adding tooltips to buttons to make the application simpler to use.
Trace Visualizer
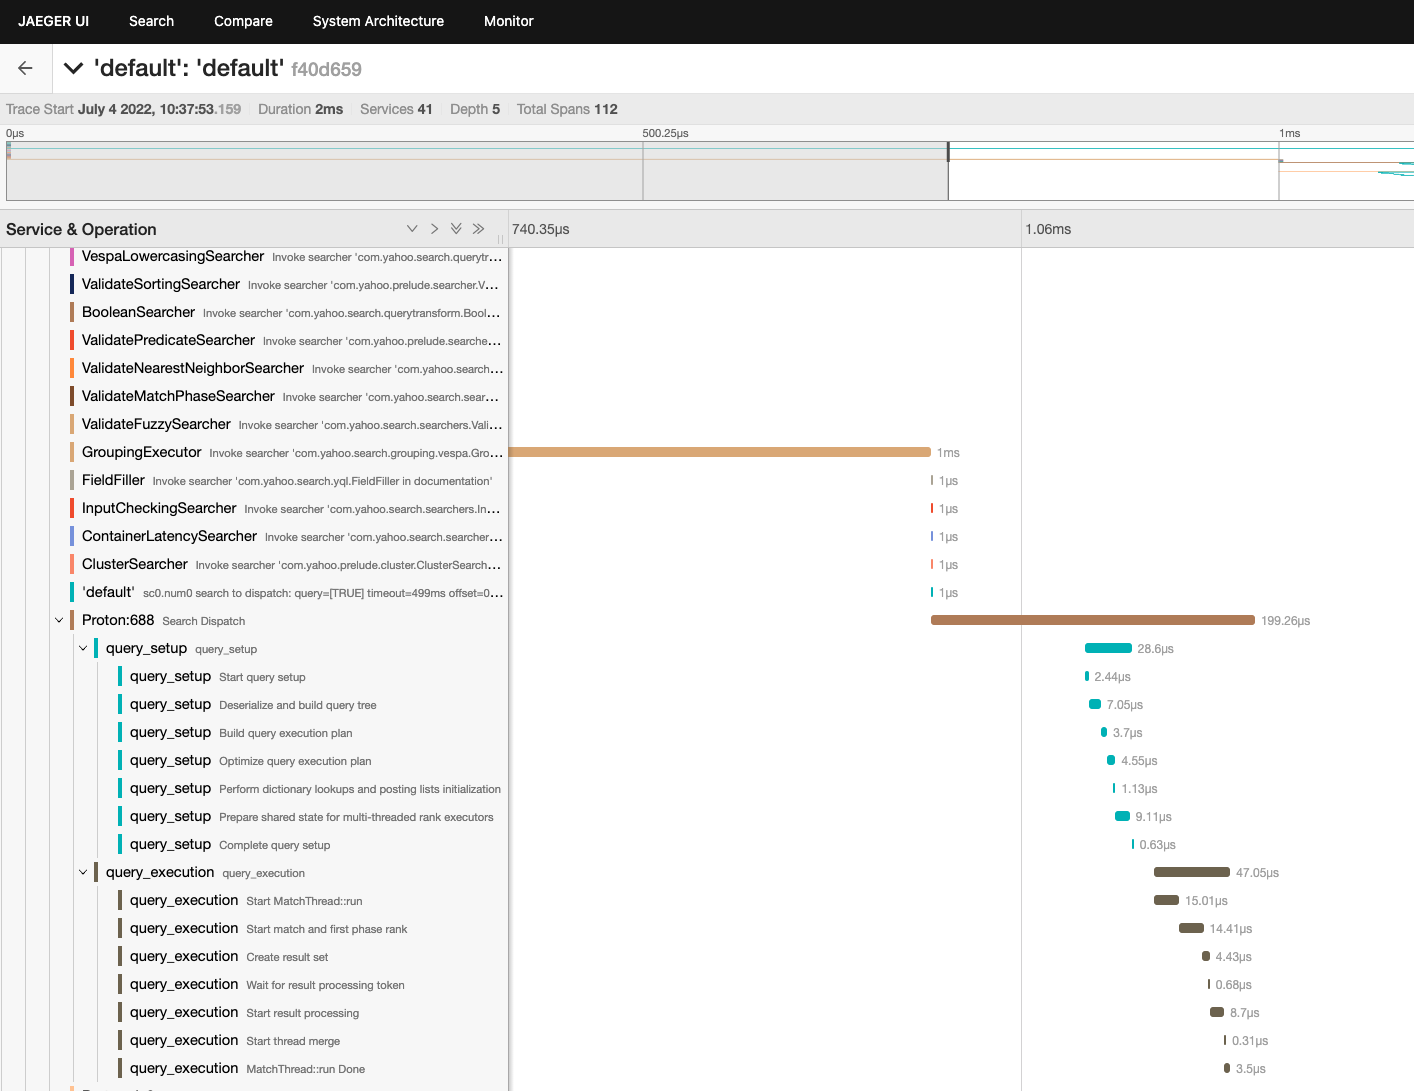
The Trace Visualizer is supposed to make it easier to identify bottlenecks in queries. The idea is to remove the need to comb through in search for where the problems could be. The solution consists of an application to input and transform the Vespa trace and the third-party tool Jaeger to visualize the transformed trace.
I started by looking at and comparing several existing solutions for visualizing traces and chose to use Jaeger because it was the simplest to use and was the best fit for the use-case. Because Jaeger did not support the traces created by Vespa the traces had to be transformed into a format that Jaeger could use. One of the formats Jaeger supports, and the one I used, is similar to OpenTelemtry´s trace definition with spans being the smallest unit of work (more information here: OpenTelemetry tracing.
The first iteration of the transformation tool could handle simple traces from Vespa and transform them into traces that could be imported into Jaeger. The hardest part was figuring out how to best traverse the Vespa trace to find the relevant information that Jaeger would need. The Vespa trace always seemed to have more special cases that needed to be handled differently just when I thought I had found them all. The Vespa trace could also be much more complicated and the first iteration could not handle them.
| Vespa trace | Transformed trace |
{
  "trace": {
    "children": [
      ...
      {
        "timestamp": 4,
        "message": "Invoke searcher ..."
      },
      {
        "timestamp": 5,
        "children": [
          {
            "timestamp": 5,
            "message": Invoke searcher ..."
          },
          {
            "timestamp": 6,
            "message": "Return searcher ..."
          }
        ]
      },
      {
        "timestamp": 8,
        "message": "Retunr searcher ..."
      }
      ...
      {
        "start_time": "2022-07-28 13:49:47.816 UTC",
        "trace": [
          {
            "traces": [
              {
                "timestamp_ms": 0.051936,
                "event": "Start query setup"
              }
              ...
              {
                "timestamp_ms": 1.045379,
                "event": "Complete query setup"
              }
            ]
          }
        ]
      }
    ]
  }
}
|
{
  "data": [
    {
      "traceID": "db187cb870b90c0ad8cc235fed504c16",
      "spans": [
        {
          "traceID": "db187cb870b90c0ad8cc235fed504c16",
          "spanID": "8182dc73c8bd68ed",
          "operationName": "default",
          "references": [],
          "startTime": 1656923873159000,
          "duration": 2000,
          "tags": [],
          "logs": [],
          "processID": "p0"
        },
        {
          "traceID": "db187cb870b90c0ad8cc235fed504c16",
          "spanID": "52bc94897ad844b6",
          "operationName": "Invoke searcher ...",
          "references": [
            {
              "refType": "CHILD_OF",
              "traceID": "db187cb870b90c0ad8cc235fed504c16",
              "spanID": "8182dc73c8bd68ed"
            }
          ],
          "startTime": 1656923873159000,
          "duration": 1,
          "tags": [],
          "logs": [],
          "processID": "p1"
        },
        ...
        {
          "traceID": "db187cb870b90c0ad8cc235fed504c16",
          "spanID": "d94b2b388d92864d",
          "operationName": "Return searcher ...",
          "references": [
            {
              "refType": "CHILD_OF",
              "traceID": "db187cb870b90c0ad8cc235fed504c16",
              "spanID": "d671eeb306d4784b"
            }
          ],
          "startTime": 1656923873159000,
          "duration": 100,
          "tags": [],
          "logs": [],
          "processID": "p7"
        }
      ]
    }
  ]
}
|
|---|
To make the tool capable of handling the more complicated traces I first refactored much of the code to make it easier to use and then I created a recursive function to handle the more complex structure that the traces could have. I also implemented better naming of the spans in the transformed trace to make it easier so see what was happening in each span. By using regex on the description of the work the span is doing it is possible to find the process that work is being done on and use this as the name of the span.
There is some further work to be done with the naming of spans as a few can get names that do not reflect the work contained in the span. The timings and durations of spans are also a bit imprecise. This imprecision is small and does not have any impact on the use of the tool to find bottlenecks. The imprecision happens because the Vespa trace mostly uses milliseconds for timestamps with some parts using microseconds and Jaeger always using microseconds there can be some problems with the timings because of imprecision.
My experience at Vespa
At the start of my internship I was excited to find how it would be to work for a software company and get insight into the workflow. I felt that I was warmly welcomed and was well introduced to the work environment.
At the beginning of my internship it was a bit daunting to have to learn both a bit about how the Vespa engine worked and how to use React and JavaScript. It was all completely new to me and at the beginning felt a bit insurmountable, but I always had colleagues that seemed eager to help me with problems.
I really enjoyed my time working at Vespa with knowledgeable colleagues who could always help me when I was stuck and have taught me alot. My experience at Vespa has been very enjoyable and educational and has and will continue to benefit me in the future.