



Deploy, Discover, Inspect, Observe: A Summer Spent Making a Public Vespa MCP Server
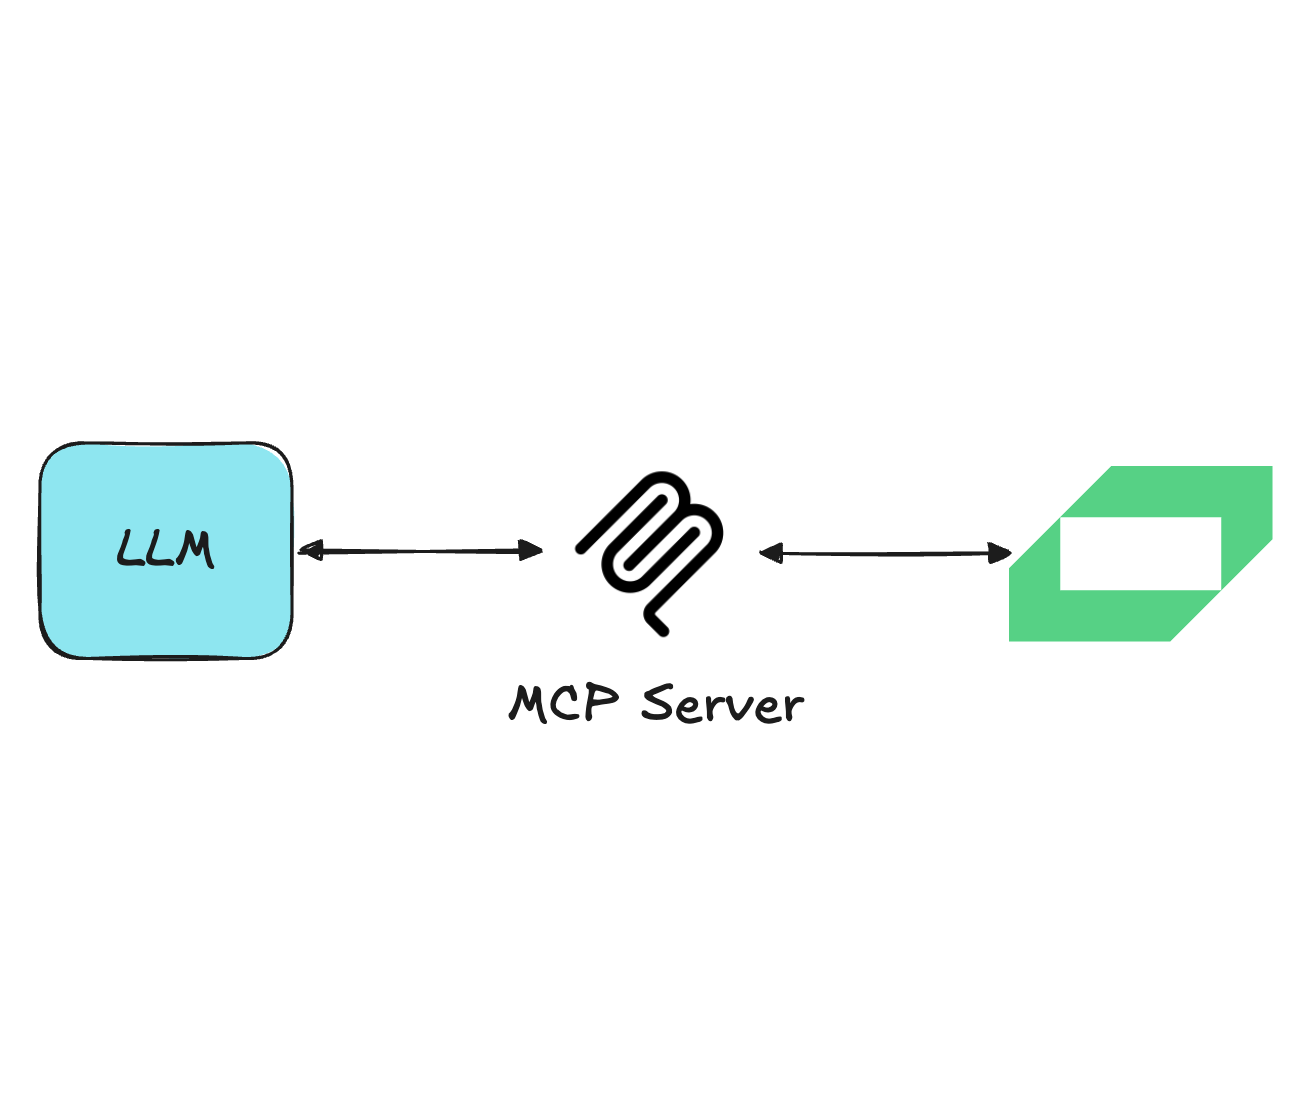
This summer, we built a standalone, public Model Context Protocol (MCP) server for Vespa Cloud. It lets AI assistants, such as Claude or Codex, interact directly with your Vespa Cloud applications. Alongside this, we looked at how to evaluate an agent’s use of MCP servers and built a harness for scoring it against simply handing the assistant a terminal and access to Vespa CLI.
In this post, we want to tell you about our summer internship at Vespa, and what we managed to build. We will quickly explain what the Model Context Protocol is, and what its benefits and limitations are, before showing off our implementation’s capabilities and discussing our experiences.
What is MCP?
So, what actually is the Model Context Protocol? Plainly, it is an open standard for how to connect AI assistants to external data sources, systems, and environments. Prior to MCP, letting an agent interact with a system meant a custom integration for that specific agent to that specific system. Now, you design and implement the service once, and then any compatible LLM or AI agent can connect to the system.
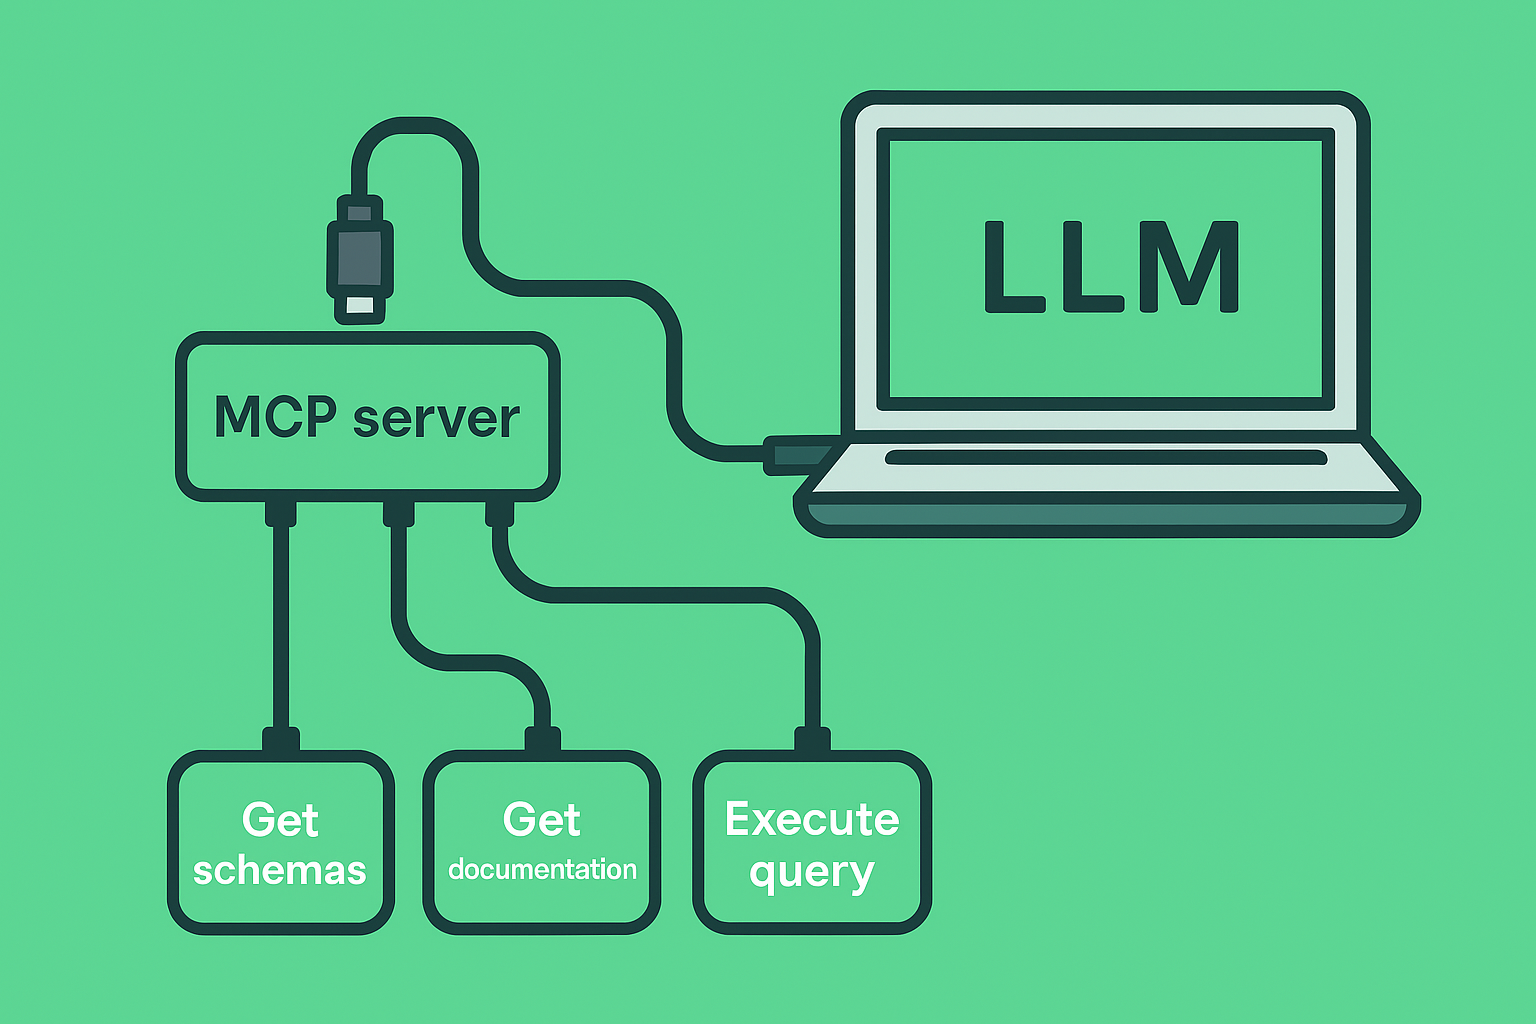
MCP enables this by standardizing the interface between a system and any assistant that wants to use it. A service (Vespa Cloud in our case) implements an MCP server and exposes capabilities in three distinct ways:
- Resources: read-only context for the LLM to understand the system
- Tools: executable actions the assistant can invoke to actually operate the system
- Prompts: reusable templates or shortcuts for structuring interactions with language models
Our implementation mainly focuses on implementing tools and letting an LLM take advantage of the right resources. Later, you can read about why designing tools is both difficult to get right and important for how an assistant uses an MCP server.
This is not the first time people at Vespa have looked into the possibilities of the Model Context Protocol. Last year’s interns implemented a server that ships with the application package, and there also exists an internal tool that runs locally, which served as great inspiration. What makes our approach unique is that the server is standalone and can be publicly hosted, meaning that any user with a Vespa Cloud account can connect to the server and have access to their own tenants and applications.
The distinction matters more than it might first appear. An application-specific server has to be shipped together with one application and typically only sees that application. This means that every application that wants an MCP connection has to ship a new server. A locally run MCP server requires installation and needs to be kept up to date on each user’s machine. Our server requires neither. It runs as a publicly hosted service, requiring no install step and no separate server to run each distinct application. The tradeoff, discussed later, is that a publicly hosted server is currently unable to securely conduct most Data Plane operations, and this is why our server currently targets the Control Plane.
MCP Tool design
Designing good MCP tools requires many considerations. Working with a non-deterministic model makes it much harder to predict what even minor changes to tools will do to the end result. Anthropic provides a variety of guidelines for designing tools, which we have used, along with our own experiences, to shape our toolset. We will walk through the design of the vespa_get_logs tool as an example of our design process.
Before an LLM can use a tool, it must know it exists and how to call it. In MCP, this is provided by the Tool Description. Our experience, reflecting that of others, was that small wording and format changes could significantly improve the likelihood of correct tool use. A good example is the time_range parameter in our vespa_get_logs tool.
Our first implementation required an agent to supply epoch milliseconds directly, giving the timeframe in absolute terms. This mostly worked, but the agent was prone to miscalculations. Using relative expressions like “now-1h”, and falling back to ISO 8601 datetime strings when needed, seemed to help. Most queries are relative anyway, and such strings are likely more frequent in agents’ training data than raw epoch integers. We learned that you should prefer parameter formats that match the use case and the model’s training data.
Protecting the agent’s context window is also critical. A naive implementation of the log tool would return the entire log for a given timeframe straight from the Vespa Cloud API. Logs produce large volumes of data, most of which is irrelevant to any given question. Feeding all of it to the agent bloats the context window, which slows down reasoning and drives up cost, without necessarily improving the answer. To address this, the tool lets the LLM choose how much pre-processing it wants: a detail parameter toggles between a compact summary and raw log lines, and a severity filter excludes lower-priority entries like info logs. This way, the agent can start with a lightweight summary and only request the full detail if the situation calls for it.
This culminated in the following tool description:
@mcp.tool(...)
async def vespa_get_logs(...):
    """Search a deployed instance's logs. Defaults to warning-and-above from the last hour.

    Repeated events (identical except for their timestamp) are collapsed into
    one entry carrying `count` and `first_seen`. The response is capped to a
    fixed size budget; when it overflows, the oldest events drop first.

    Args:
        start_time:
            Start of the time range.
            Accepts relative expressions ("now-1h", "now-7d") or ISO datetime strings.
            Defaults to "now-1h".
        end_time:
            End of the time range.
            Accepts the same formats as start_time. Defaults to "now".
        min_level:
            Minimum severity, most-to-least severe:
            fatal, error, warning, info, config, event, debug, spam.
            Pass "info" for normal logs, None for all.
        contains:
            Case-insensitive substring over service, component, and message.
        limit:
            Max events returned, most recent kept (default: 100, range: 1-100).
            Values outside this range are clamped and reported in the
            response warnings.
        detail:
            "concise" (time, level, service, message)
            or "detailed" (adds host, pid, component).
        ...
    """
Both point to the same conclusion: good tool design is less about exposing everything an API can do, and more about shaping the interface so the agent makes good decisions when deciding how to use tools.
Benefits
Now, why would having a publicly hosted Vespa MCP server be useful? One might think that just handing an LLM the Vespa CLI and a terminal would give it the same capabilities as having an MCP server. That is not quite true. What separates the two approaches is control, and as it turns out, capability as well.
Let’s start with control. A tool-based interface lets us define how an agent is able to use the access we provide. We can decide what actions are possible, instruct on when to use certain tools, and ensure that unwanted actions are impossible. This control starts before a tool is even called. Each tool defines the exact structure of the input it expects, making it easier for the agent to know how the tool should be used in the first place. This results in fewer attempts needed to call it correctly, as opposed to a trial-and-error approach towards the CLI.
Structuring available tools and giving the necessary context also guides the LLM toward how to solve problems in the first place. As we will see later, this also results in the agent making fewer mistakes. It will always know what actions are available to it and have information about how to use different tools. On top of this, the server chooses how to present error messages, meaning that tools fail informatively and hand the assistant the next step for fixing the problem, rather than the model having to interpret raw error messages.
An MCP server is not limited to wrapping existing commands; it can expose entirely new capabilities built specifically for how an assistant uses it. Our tools surface Grafana metrics directly, giving the assistant real observability data with no current CLI equivalent. More on what possibilities this provides is elaborated on later in the post.
Lastly, a server is convenient. Connecting an LLM to a hosted MCP server is basically plug and play. Meaning that both new and experienced developers can start using it in a matter of minutes. For new Vespa devs, having an MCP server to help your AI assistant poke at Vespa, explain features, and teach you how to design applications becomes invaluable. For the experienced dev, letting the LLM handle time consuming jobs, such as debugging why an application has poor quality of service, opens up time for other tasks that are more important.
MCP Limitations
During our development of the MCP server, we experienced some protocol limitations we had to work around.
The first case occurred when designing the tool for deploying applications. An application package consists of several files that define the application; node structure, schemas, authentication, etc. The challenge was how the LLM should upload these files to the MCP server. There exists no built-in way to upload files in MCP today, so we ended up exploring several possible solutions.
Our first attempt let the LLM upload a JSON object with a dictionary mapping from file names to file contents. This approach was simple and required only one tool call, making it fast for a single deployment. On the other hand, small tweaks to applications required the LLM to rewrite the entire package, and uploading binary files, such as embedding models, was not possible. Therefore, we had to look into other solutions.
Most agents have access to some sort of terminal, either locally or in a sandbox environment. Therefore, we assume that the agent is able to zip the application package, but how do we send this over the MCP server? We tried Base64 encoding the files and using them as input for the tool. Copying encoded data is, however, something LLMs struggle to do accurately and quickly. So, our second attempt wasn’t satisfactory either.
Our solution was to avoid the protocol altogether. Instead, the tool returns a unique URL to a separate HTTP endpoint for uploading the package. Then the LLM can zip the package and use curl to upload. On one hand, this means more tool calls and slower execution for a single deployment. On the other, it ends up being faster with several deployments, as it does not have to rewrite the entire package to make small adjustments. From our experience, several deployments are often needed, making us prefer this solution over the others.
The second limitation we faced while developing the server was also related to the deployment tool. The time it takes to deploy a Vespa application can vary from seconds to several minutes. Therefore, we had to decide if the MCP tool should return immediately and have the LLM poll for the deployment result with a separate tool, or block until the deployment is finished.
Letting an LLM poll the status means many tool calls per deployment, costing valuable tokens, and often resulting in the assistant just setting a timer after a few attempts. The deployment might, however, finish early during the timer, leaving the LLM to do unnecessary waiting. In contrast, letting the tool block might keep the agent from working in parallel. It also gives no feedback to the user, leaving room for confusion as to why the tool appears frozen.
We decided that having the tool block was best, but added a timeout as a parameter so it doesn’t wait too long. This way, there is some feedback along the way, and the LLM can choose to do other tasks while deploying. It still requires several tool calls for a deployment, so the solution is not optimal. During the summer, a new mechanism for “long running tasks” was added to MCP, which seems to solve our problem. Once this is adopted by most MCP clients, the deployment tool will probably be refactored to use this feature.
Using the MCP server
Using the MCP server, we could now create a Vespa application from scratch only through prompts. In this case, we started with a simple prompt about wanting a blog application with Vespa serving as the search engine. In a few minutes the model created the Vespa Cloud application and a web page, then connected the two. To tune the search, we just needed to specify what results we wanted to surface for a given query, and the model would make appropriate changes to the schema and redeploy.
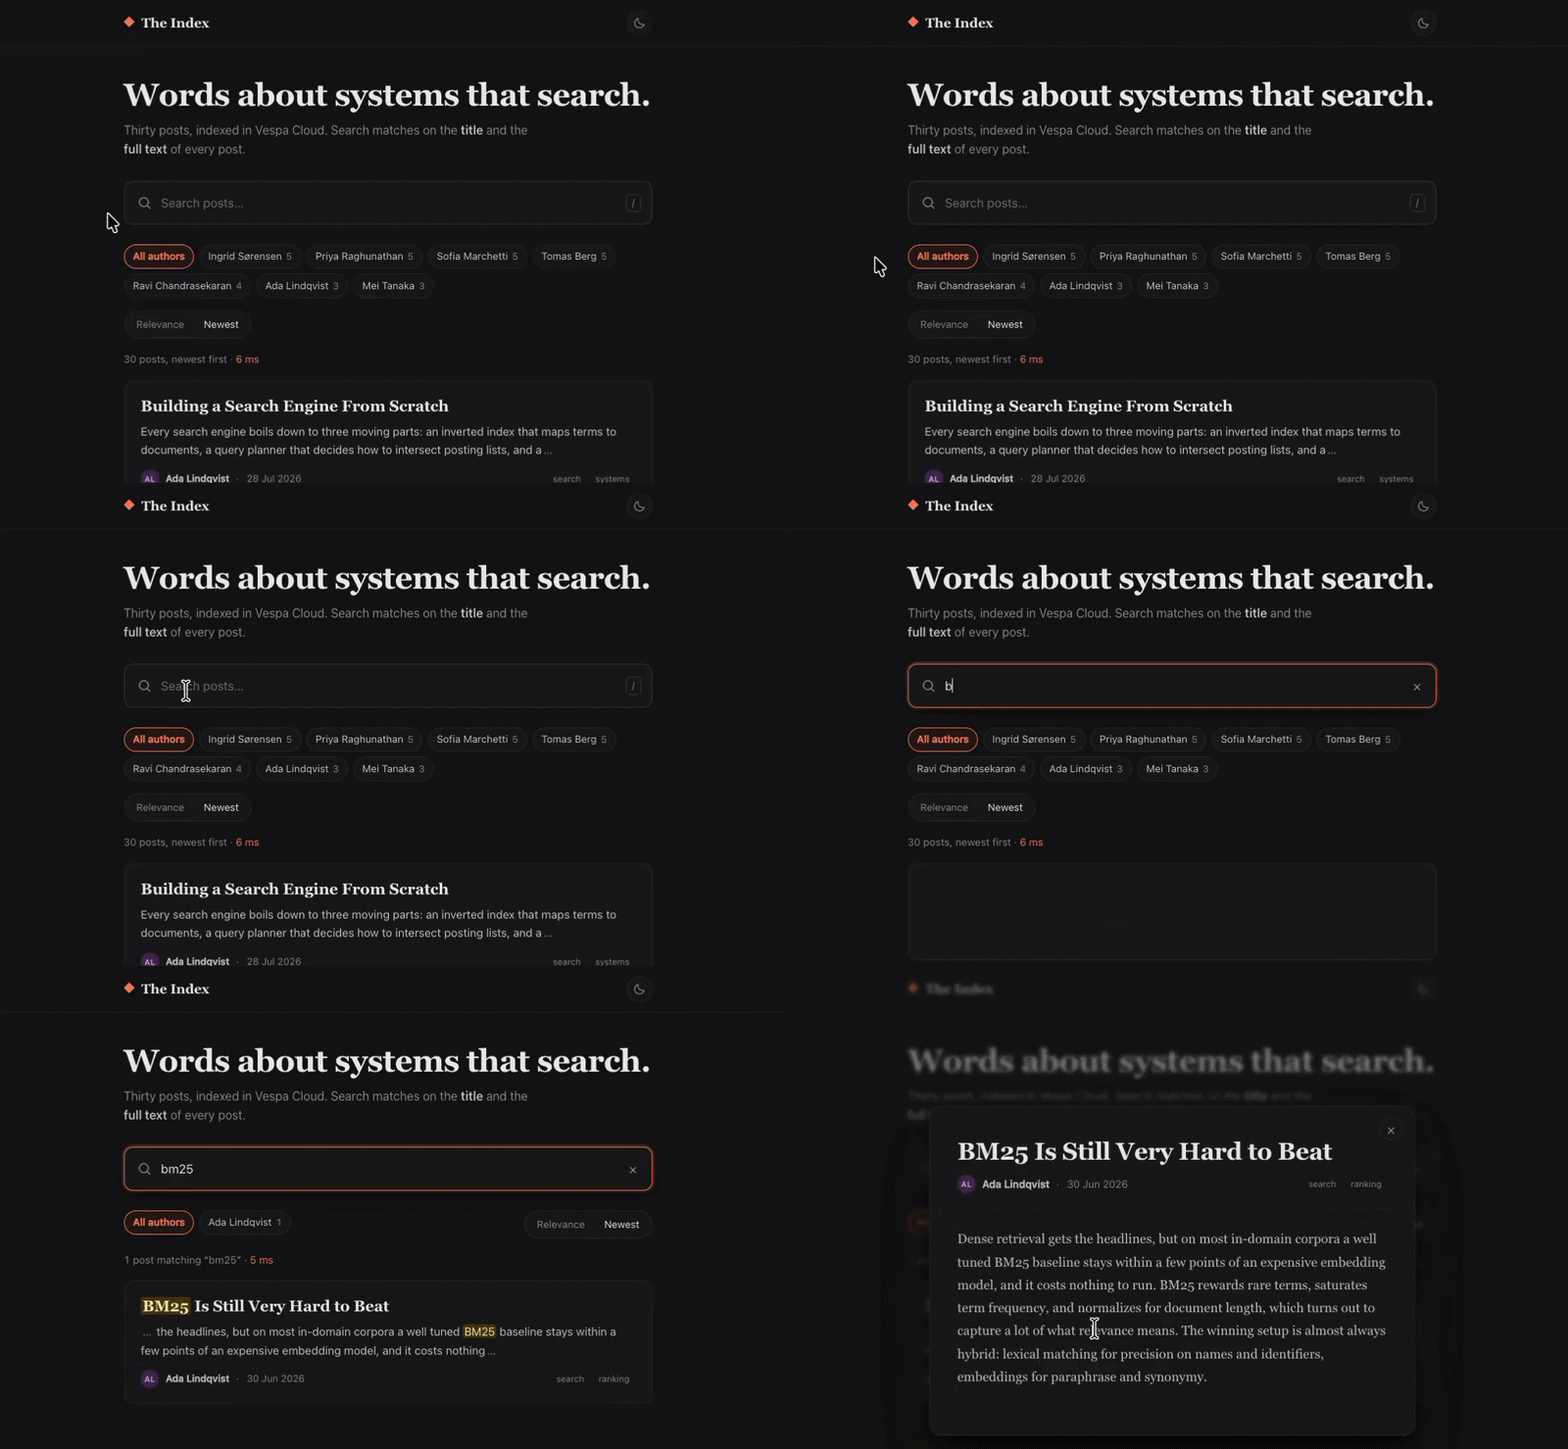
This showcases one of the more interesting use cases for our MCP server. Simply explain to the LLM what kind of application you want, and in a matter of minutes it is up and running. Perfect for new Vespa developers who want to get started, understand how Vespa works, and see what possibilities it provides.
Extending the capabilities with metrics
Thus far, most of the functionality of the MCP server can also be done using the Vespa CLI. The next step was to add something beyond what Vespa CLI can do currently. In the Vespa Cloud Console, there is a Grafana metrics dashboard for each application, with hundreds of metrics for any time window. Each metric panel has a short explanation of how to interpret the data. Giving the MCP server access to all of these metrics is useful for debugging and monitoring applications.
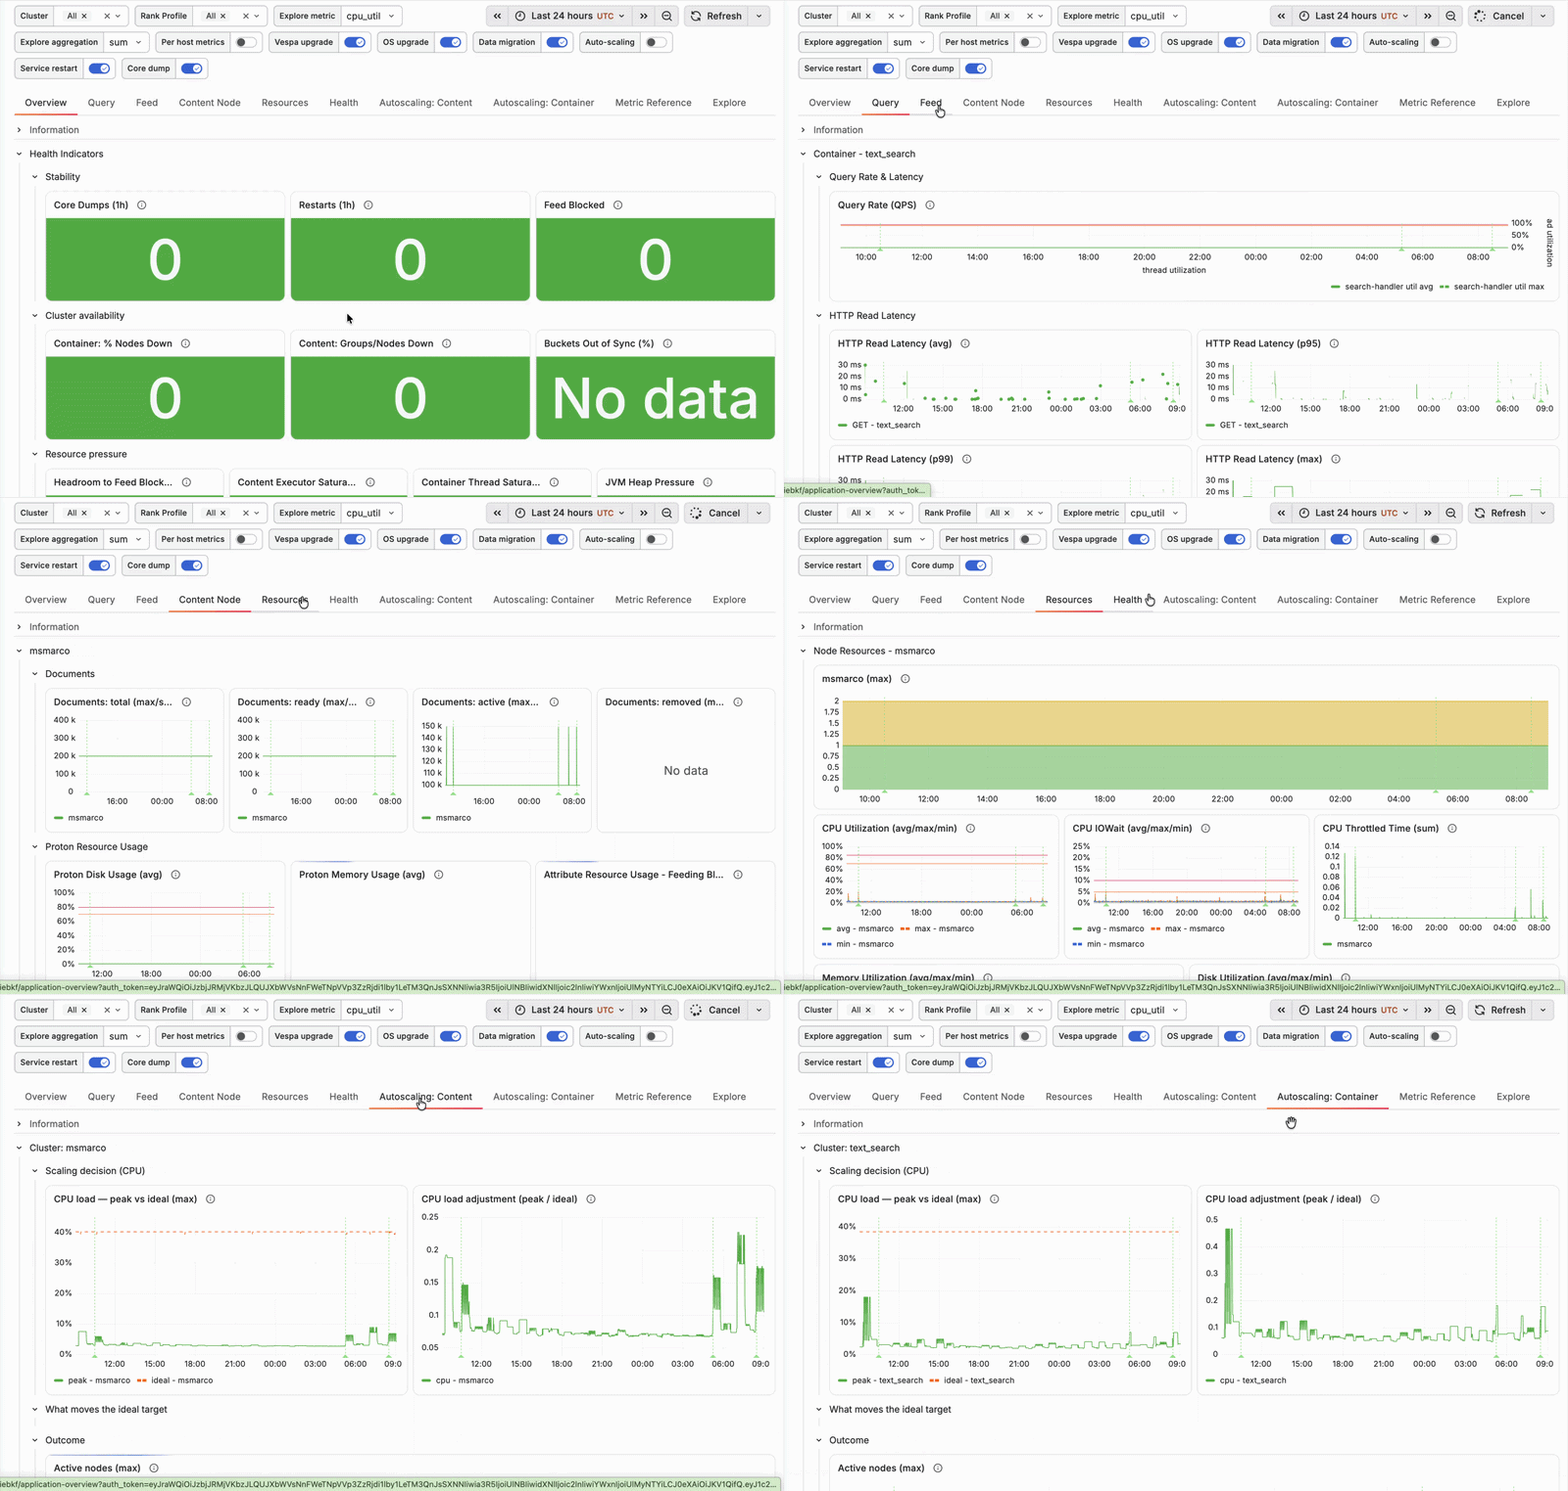
To implement this, we first looked at what API endpoints Vespa has for metrics. We quickly realized that all the endpoints only gave the metrics at the current time, with no way of looking at the metrics for the last week or month. The capability of looking at metrics for a specified time would require storing all metrics, for all timestamps, for all applications, at all times. This approach was unnecessarily complex, and it would essentially mean duplicating the existing functionality of Grafana.
Instead, we started looking at how the Vespa Cloud dashboard gets all its metrics. After some reverse engineering, we found the endpoints used to get the structure of the dashboard and also how to query the actual metrics data. Then, the only thing needed was to add some tools so that the LLM could get access to the panels with descriptions and data, directly from Grafana.
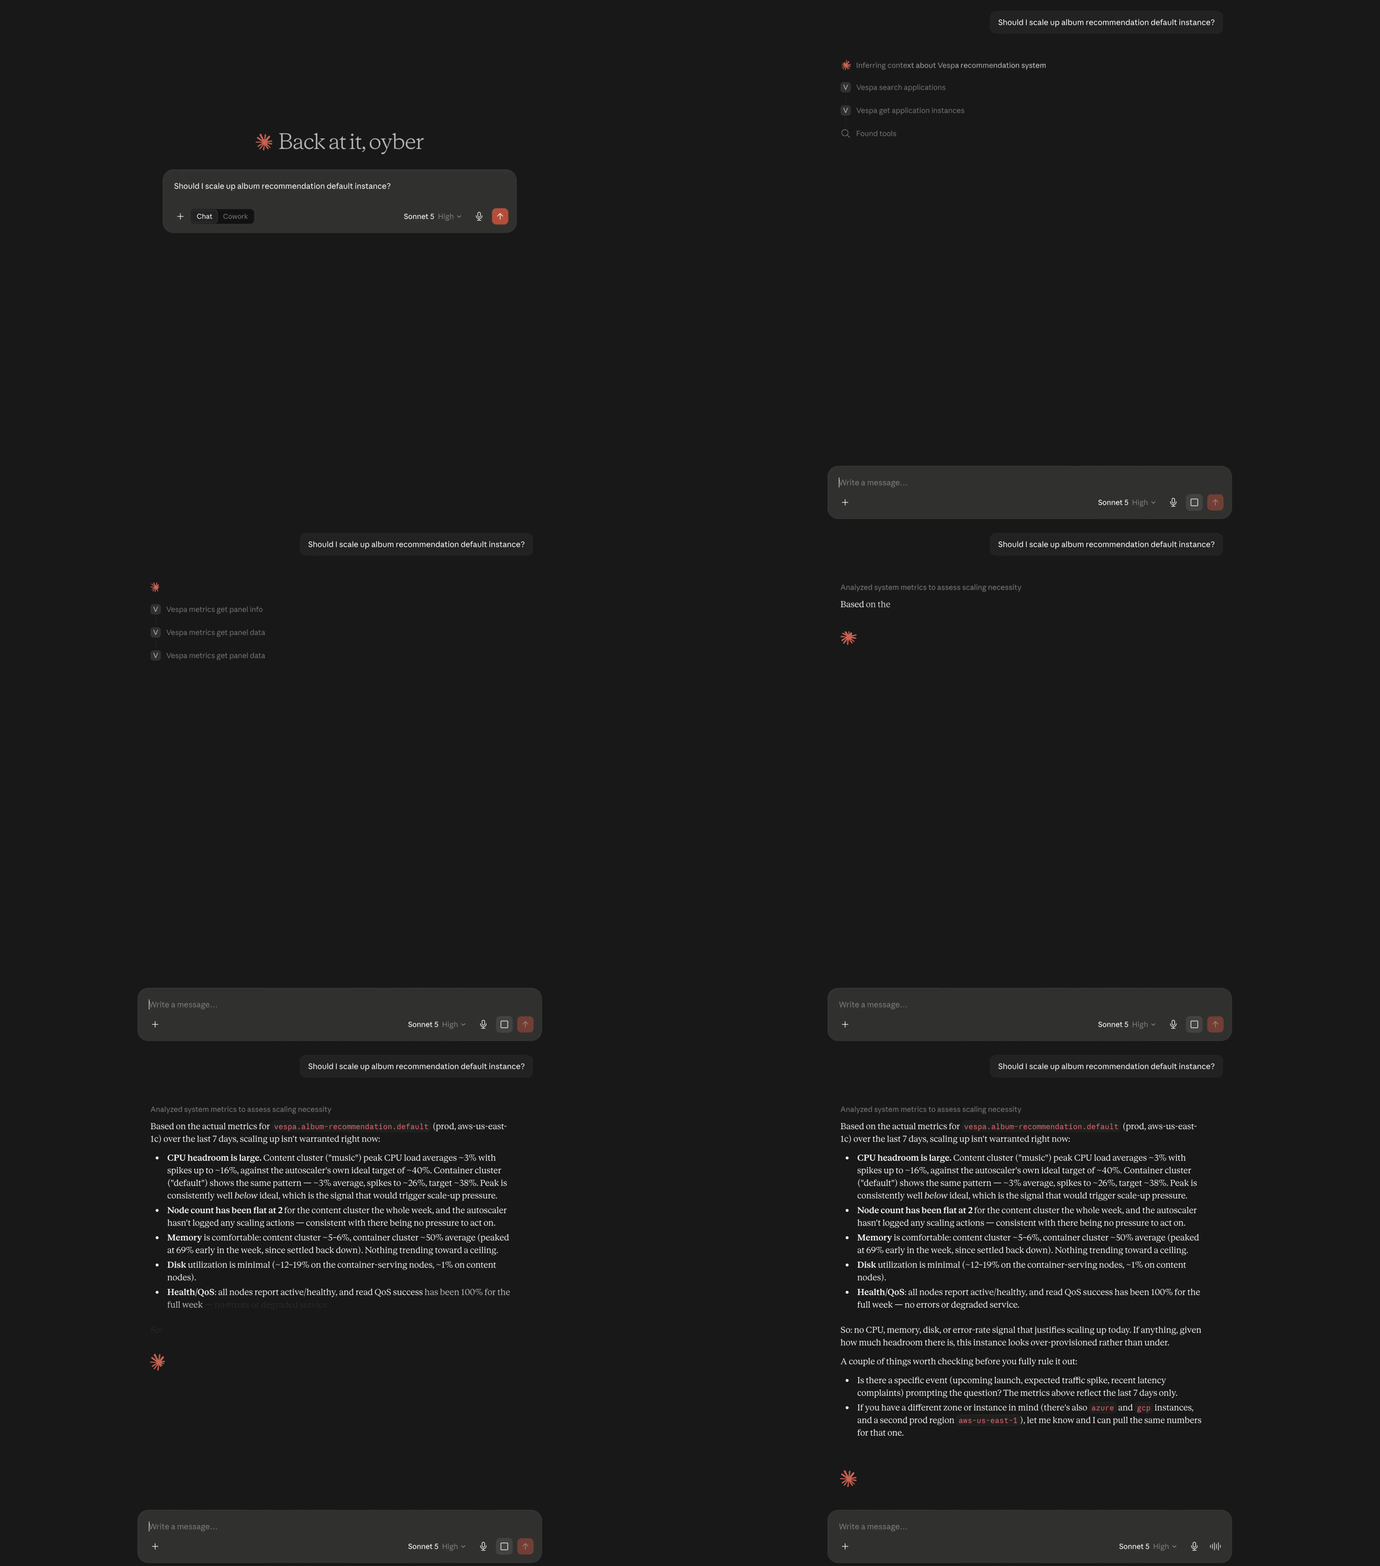
When this was implemented, we wanted to see what it could help us do. We started by consulting an LLM on whether or not our application needed to be scaled up. After looking at several metrics of resource usage, it correctly decided that it does not need upscaling.
Next, we tried to restart one of the content nodes of an application, to see if the LLM could explain the sudden increase in the number of active documents. After 17 tool calls checking different metrics, deployments, and logs, the LLM was able to correctly identify that a node was restarted, in addition to explaining that it was likely done by a Vespa Cloud host.
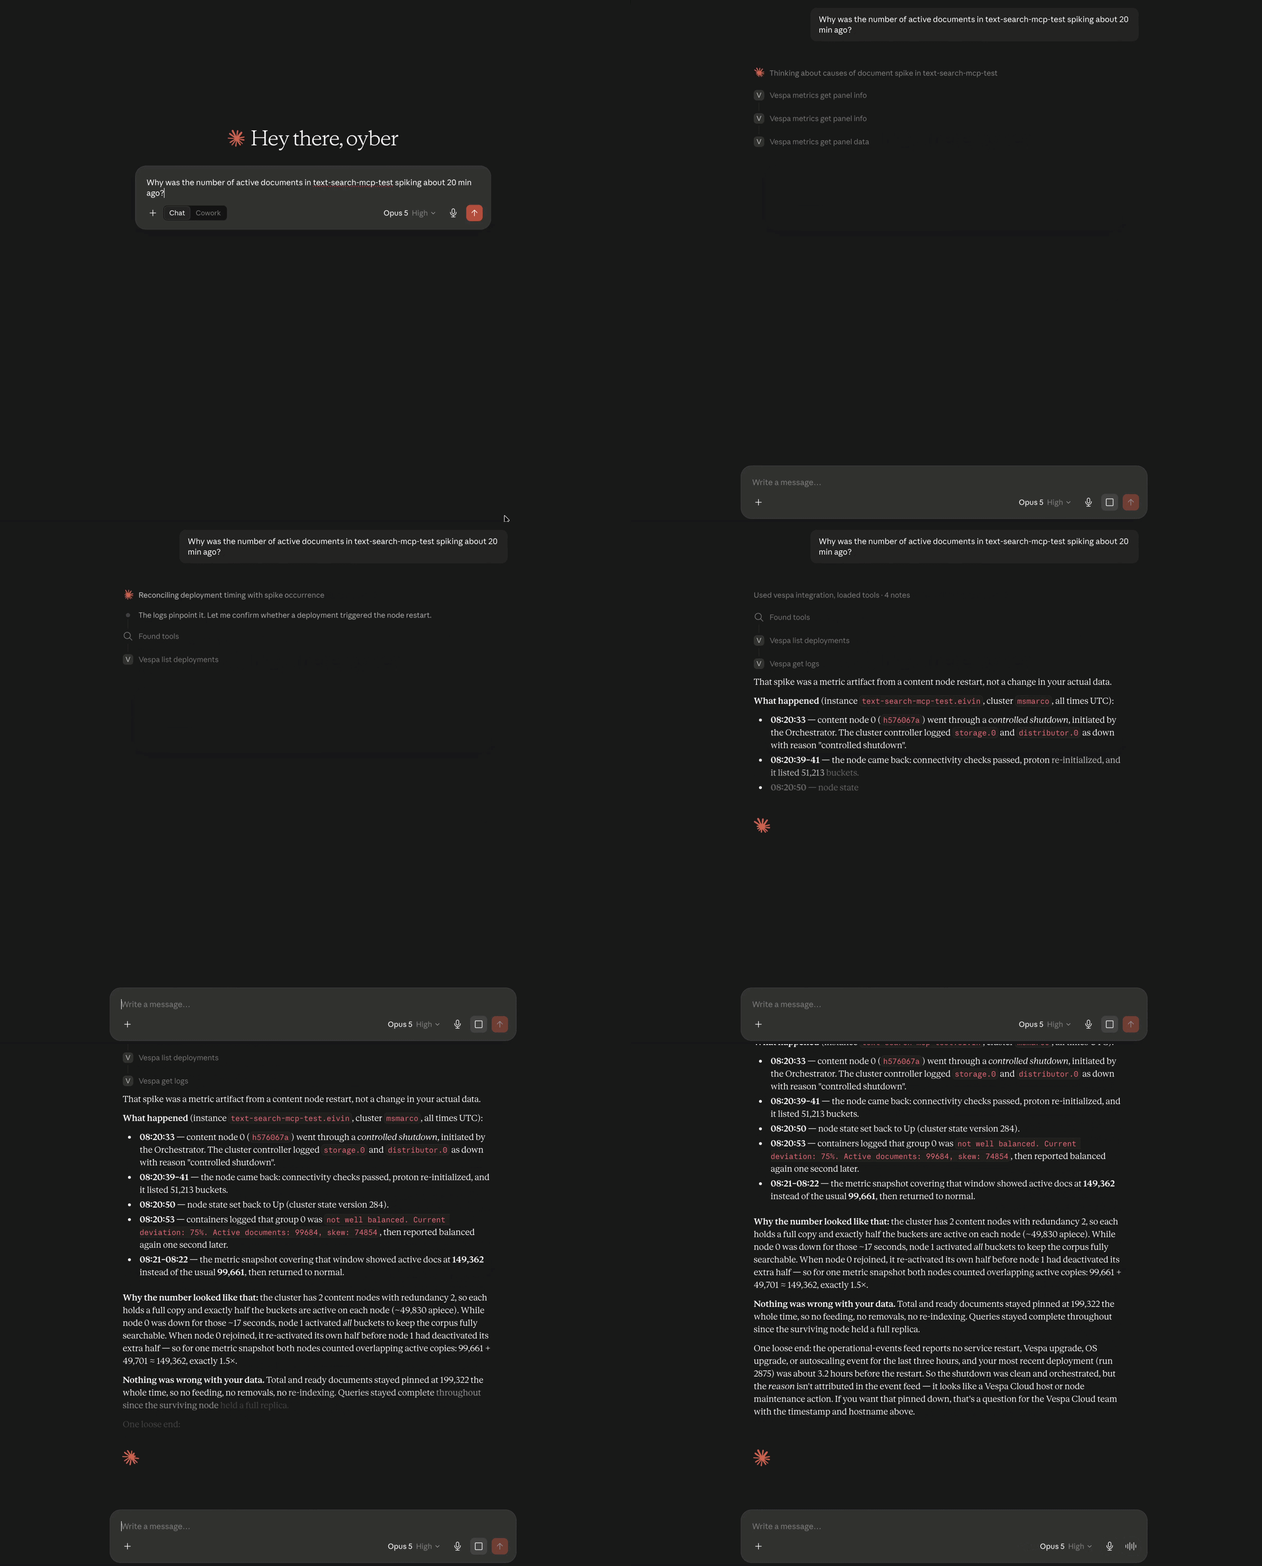
Looking through metrics data manually can be time-consuming, but from our testing, the LLM seems to be good at crunching through the numbers. This shifts the role of the developer from diagnosing to fixing. We are excited to see if this can be useful in real world scenarios.
Authentication Issues and Server Hosting
An internet-exposed MCP server requires tight security, as anyone can send requests to it. We have to treat each incoming request as potentially malicious, while also serving legitimate requests. Vespa Cloud handles authentication in two different ways, based on the type of information you want to access. Our server needed both in order to get the functionality we wanted.
The Control Plane was the easy half. It authenticates with Auth0, so we could re-use the same logic used by the Vespa Cloud Console, where one authentication flow gives the user access to their applications. The MCP Server would act as an OAuth proxy in front of Auth0, where clients register with the MCP server before they’re handed off to Auth0 for the actual authentication.
The Data Plane is where things got messy. To query a Vespa Cloud application, you need a separate token, scoped per application, so the Auth0 magic simply doesn’t work here. Our workaround, for testing purposes, was to hardcode a pre-generated token into the server. It worked for the single tenant we tested against, but wouldn’t scale to multiple users from different tenants.
The solution for this was not quite obvious, so we explored some options. The simplest fix would be to require the tools to provide a token parameter; however, this is blatantly insecure and the MCP spec disallows it. Another was to mint temporary Data Plane tokens using your Control Plane authentication; however, this would require changes to how tokens are minted, which was out of scope for our summer project. We ultimately settled on our workaround until a cleaner solution is available.
Authentication to third party APIs (e.g., the Vespa Cloud API) seems to be an ongoing discussion in the MCP protocol, with recent developments like URL elicitation representing early attempts at addressing it.
One of the goals we had for this project was to host the MCP server ourselves. During the summer, the 2026-07-28 MCP spec was released, which removed protocol level sessions along with the initial handshake. This change made hosting considerably easier. With this change, any request could be served by any instance, so the server deploys and scales like more traditional HTTP APIs, instead of needing the sticky routing or shared state that was required previously.
Does it actually help?
Handing an LLM a big toolbox does not automatically mean it will use it well, or even better than it would have without the toolbox at all. We therefore wanted to find out:
Does having this MCP server actually help an LLM operate a Vespa Cloud application better than just giving it the Vespa CLI and a terminal?
Evaluating that, however, turned out to be easier said than done. There’s rarely one correct sequence of tool calls for a task. For example, an LLM might discover a schema by first listing applications or simply by jumping to vespa_list_schemas if it has already guessed the application’s name, and both can be perfectly good. Worse, an LLM’s behaviour would change from run to run. Two different runs on the same suite, with the same code, might yield two completely different results, making the “correct solution” even harder to define. Any single run is a weak signal, and the “answer” is not something you can hard-code.
So, we grade two ways. Deterministic assertions check the outcome against the real Vespa Cloud API: does the application exist? Are its nodes healthy? Does the deployed schema contain the fields it should? An LLM judge scores the process against a per-scenario rubric: did the agent reach for the right concepts? Did it fix the actual bug rather than paper over it? We found that neither is sufficient alone. Assertions can’t distinguish a lucky guess from sound reasoning, and an agentic judge should not be trusted with facts that can be checked deterministically.
Across three full sweeps of the evaluation scenarios, both agents mostly got there in the end. The MCP agent passed 97% of the deterministic assertions versus the CLI agent’s 95%. Seeing this, you might be tempted to think that the tools barely help.
We don’t think so, and the giveaway is the number of tries it took to get there. Agents using the MCP server averaged less than half the number of attempts before deploying successfully. Further, the use of MCP resulted in more scenarios passing cleanly, resolving faster, and averaging a better rubric score when judged by another LLM.
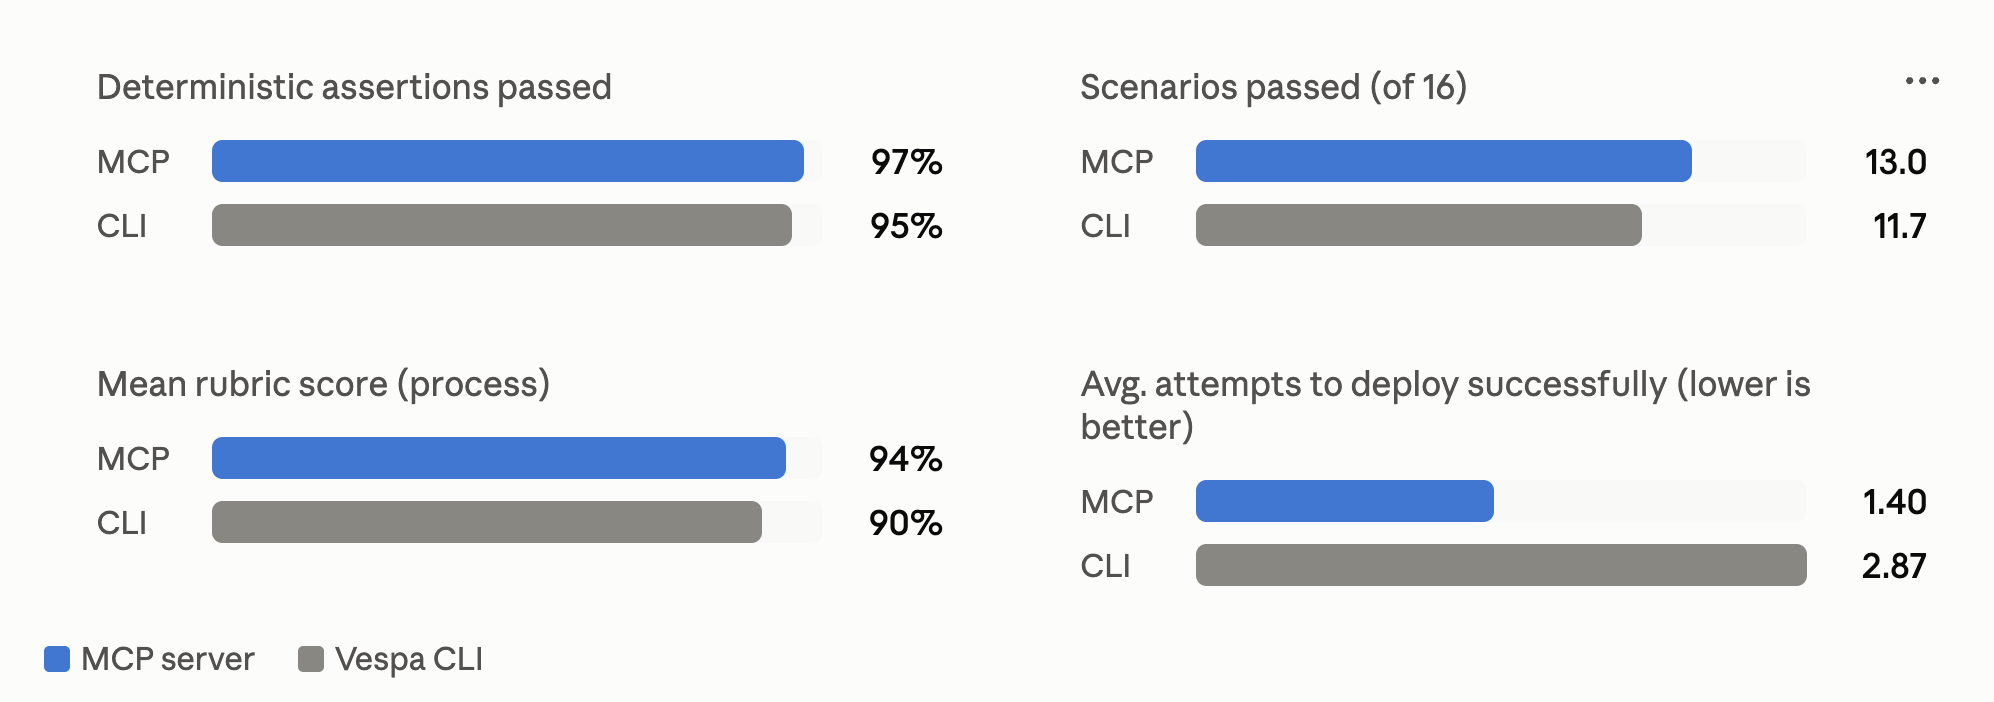
Tools don’t make the model smarter; they make it wrong less often.
A determined enough model will eventually find the correct path to make it work, regardless of interface. However, the MCP server buys you fewer wrong turns, even if it costs a few more tokens.
A model typically needs to discover the tools before using them, resulting in actions that don’t produce task progress. The extra cost comes from every tool’s description having to be held in context on every turn, whether or not they are used. An assistant using the CLI carries none of this overhead. It already knows or guesses the commands and has no need to discover them or keeping track of the descriptions. However, mistakes are not free either: a malformed deploy still costs time and tokens, and has to be fixed afterwards.
Meaning, it is not so much “cheap CLI” versus “expensive MCP” as it is two ways of spending the same budget. Either up front on discovery and structure, or on the back end recovering from mistakes. We’d expect that trade to favor the MCP server more as tasks get harder and wrong turns become more costly.
What’s missing
The most obvious missing part is proper Data Plane access. The workaround we created limited us to one hardcoded tenant, so it’s not ready for production. That said, our explorations suggest a Control Plane only server is feasible without too much additional effort.
Furthermore, the whole server is undergoing a security review to ensure it is up to our standard before a possible public release. We are also taking a harder look at what tool guardrails we should include to ensure safe usage.
Lastly, we need feedback from real people using the MCP server. One of the hardest challenges in creating the server has been figuring out what tools to include, and feedback from actual Vespa Cloud users would help a lot.
Our Summer at Vespa
After a summer spent exploring the Model Context Protocol, with both its limitations and strengths, we end with a working MCP prototype that lets you deploy, discover, inspect, and observe your Vespa Cloud applications. We have had to solve problems facing a continuously evolving protocol and implement functionality not already existing in the current ecosystem. Overall, we are proud of what we have created, and hope that it can be of use to Vespa Cloud developers in the near future.
Finally, we would like to thank all our colleagues at Vespa for trusting four interns with a surprising amount of freedom and production access, as well as a lot of patience for all of our questions. We have had the opportunity to learn an incredible amount this summer, and we wish the whole team further good luck.

 Never miss a story from us, subscribe to our newsletter